
Background
On October 30, KeyCorp announced its planned acquisition of First Niagara. The combined institution would become the 13th largest bank in the United States. When factoring in the assumption of preferred stock, the total purchase consideration was roughly $4.4 billion, with about 80 percent of the deal payable in KeyCorp stock. In terms of multiples, the deal valued First Niagara at roughly 1.7 times tangible book value and 18 times earnings.
KeyCorp’s stock plunged by 7 percent after the announcement. Analysts and many investors were miffed at the transaction, mainly for the dilution to tangible book value. KeyCorp itself estimated the payback period required to recoup the dilution would be as long as six to 10 years, which is considered excessive in today’s market. Some analysts thought it might take even longer, especially given First Niagara’s recent troubles, which included several questionable acquisitions after the financial crisis, a botched acquisition of branches from HSBC in 2011, and an expensive overhaul of its technology platform in 2014.
Overview: Why The Market is Wrong
If KeyCorp can even remotely execute on this transaction, it will have created far more shareholder value than standing alone in the current and expected economic environment. Here are five nuggets of yet-to-be-discovered gold that our analytics reveal:
1) The growth in the loan portfolio that KeyCorp will recognize by acquiring First Niagara presents a far better risk/reward tradeoff than organic growth. We ran our proprietary analytics on First Niagara’s loan portfolios to better understand their vintage composition. That enables us to quantify the quality of the loan portfolio more accurately than a thorough (and far more expensive) loan
Let’s dig into First Niagara’s Residential Real Estate 1-4 Family portfolio:
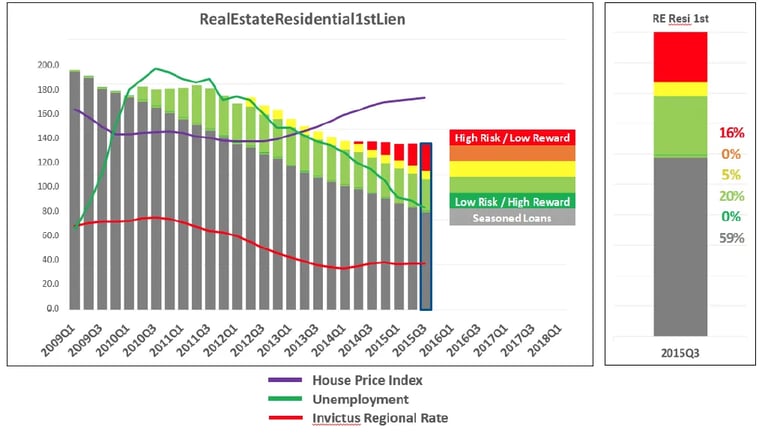
We analyzed the lending environment of every quarter since the financial crisis and assigned scores based on the risk/reward profile of loans originated. (Using public data to estimate loan vintages, Invictus can provide a snapshot of the risk/ reward profile of loan portfolios for any bank in the country.) The gray color represents pre-crisis loans, which tend to carry a relatively higher yield than most post-crisis loans and are seasoned, right-sized, and written down. All post-crisis loans have been grouped into five tiers based on their risk and yield at origination, with green representing loans with the lowest risk and highest yields, and red representing highest risk and lowest yields.
First Niagara’s mortgage portfolio has shrunk over the last six years, which the market may consider an indication of poor performance. However, the lack of organic growth has led to a portfolio predominantly composed of loans originated when market rates were higher (gray and green loans). As a result, the total portfolio has an attractive yield compared to banks with higher growth in recent years.
Consider KeyCorp’s mortgage portfolio from a risk/reward perspective:
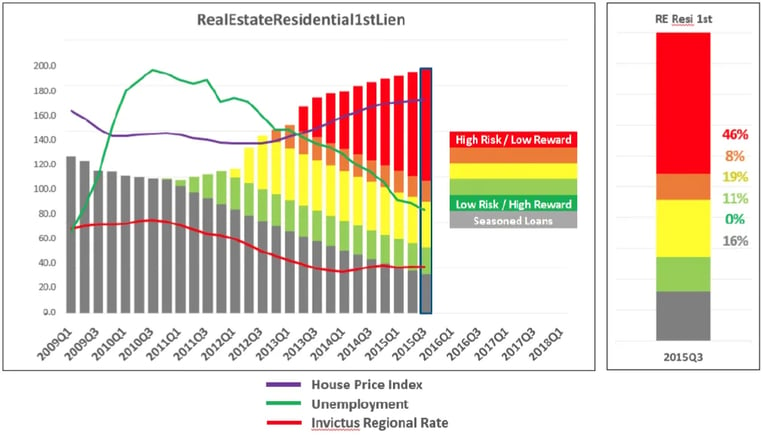
KeyCorp has achieved significant growth over the last three years. While loan growth in the red zone provides a better return than cash or securities, it has a negative effect on the risk/reward profile of a bank’s portfolio. This is of particular concern in higher duration portfolios such as mortgages, where low rates affect overall yields for years to come.
A concept often forgotten is that M&A, as a strategic planning tool, is a time-compressed growth mechanism. Let’s compare two more years of organic growth for KeyCorp versus an acquisition of First Niagara. In the following example, we assume an acquisition of First Niagara’s $3.7 billion mortgage portfolio as of 9/30/2015, and allow the portfolio to run off/pay-down/amortize to $2.8 billion over two years. We compare that to a scenario in which Key Corp generates organic growth of $2.8 billion over the same horizon:
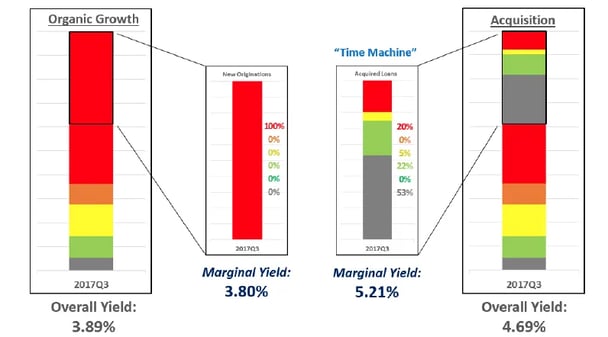
The difference in marginal yield is massive. KeyCorp would have to price loans very aggressively to add $2.8 billion of loans organically over the next two years. We estimated 3.8 percent as the average marginal yield on these new loans.
But KeyCorp would acquire $2.8 billion of loans from First Niagara in the M&A deal. The average yield on this portfolio would be 5.2 percent, which is significantly greater than the organic growth. And the risk of the First Niagara portfolio is far less than newly created loans at the tail-end of the credit cycle.
In a low interest rate environment with higher collateral prices, KeyCorp’s only option to achieve organic growth would be with these low rate/higher risk loans. This is why its future loans would be of the red variety. Any attempt to mitigate this through underwriting would be offset by competitive conditions. In this respect, M&A acts as a time machine to add loans originated in the green and grey environments, which now have a far better risk/reward trade- off.
The success of M&A, like any strategic decision, rests ultimately on an efficient use of capital. Bank regulators are also focused on the combined entity’s capital adequacy under a severe stress environment. So we need to understand how the risk/reward analytics described above relate to capital.
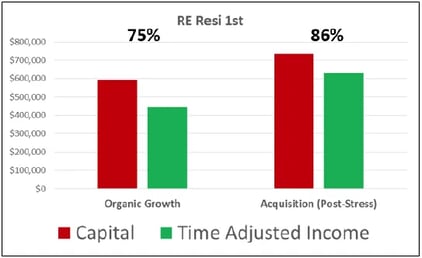
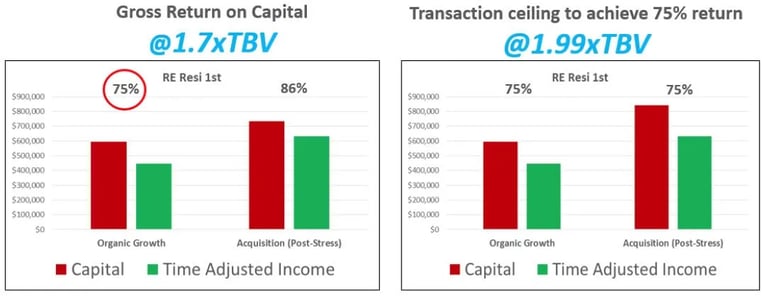
Our analysis used Invictus’ unique proprietary stress testing techniques to allocate capital to the loans. We then calculated a gross return on capital for organic growth versus the acquisition at the announced multiple of 1.7 times tangible book value. The gross return on capital compares the present value of gross interest income from the loans to the capital required to support them (including the impact of deal pricing and structure in the acquisition). This ratio may be meaningless by itself, but it provides a quick and highly accurate way to compare organic growth with M&A. At the announced deal value, KeyCorp can expect a 2-year gross return on required capital1 of 86 percent on the residential mortgage portfolio it acquires from First Niagara. This includes the premium paid on the transaction. However, in the scenario where we replicate enough organic growth over the next two years to match the transaction, the gross return on capital is far less — at only 75 percent.
2) First Niagara has more than $400 million of FreeCapital™ (excess capital calculated via a stress test) that the market has forgotten. With a Tier 1 Leverage Ratio of 7.1 percent, Common Equity Tier 1 Ratio of 8.5 percent, and Total Risk Based Capital Ratio of 12.0 percent, you wouldn’t think that First Niagara would hold meaningful amounts of excess capital. However, we ran a CCAR-style stress test on First Niagara using our proprietary Invictus Capital Assessment Model (ICAMTM) and estimated it would emerge with a healthy amount of cushion.
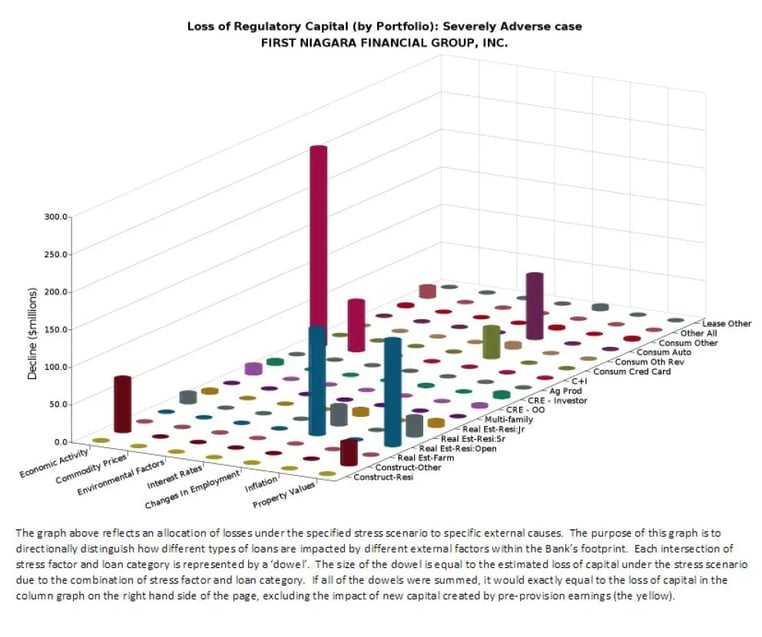
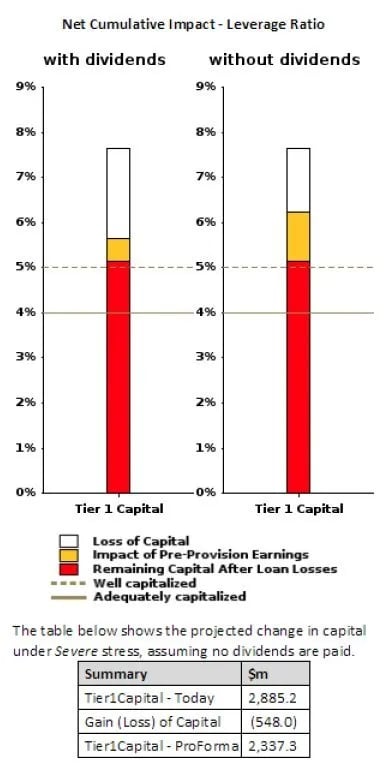
Our stress test is far more stringent than First Niagara’s DFAST model, which calculated that the bank would basically break even, with pre-provision earnings offsetting loan losses. In fact, our test errs on the conservative side. We used publicly-available information to drive our stress test and subjected these assets to the more rigorous conditions required for larger banks under the CCAR model, as they would be for KeyCorp going forward.
 The cushion that emerges after the test effectively represents the bank’s excess capital. When we use the results of the stress test to customize First Niagara’s capital requirements as a stand-alone entity, we estimate its minimum CET1 Ratio should be 7 percent, leaving it with $422 million of FreeCapital™.
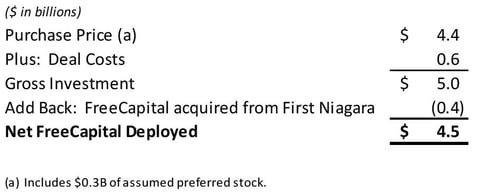
Since KeyCorp is a CCAR bank, it will end up capturing First Niagara’s FreeCapital™ — and that’s even before it models in the cost synergies of the acquisition. Ironically, CCAR will provide KeyCorp with a vehicle to free up this capital. The bottom line is that KeyCorp acquires $422 million of FreeCapital™ from First Niagara. This reduces the amount of capital KeyCorp actually deploys in the transaction since it can use this $422 million however it wants. As a result, it essentially only paid 1.5 times TBV as opposed to 1.7 times TBV.
3) The return on capital deployed in the transaction will generate an annual return of 17 to 20 percent for KeyCorp shareholders. KeyCorp has noted in its public disclosures that it expects to generate a 15 percent IRR and a 10 percent ROIC from the deal. However, when we actually looked at the net FreeCapital™ deployed after we adjust for First Niagara’s FreeCapital™ of $422 million that KeyCorp will get back, we estimate the return on FreeCapital™ deployed could be as high as 17 to 20 percent. It is important to break this down.
First, let’s calculate how much FreeCapital™ KeyCorp will need to invest in this deal: ($ in billions)
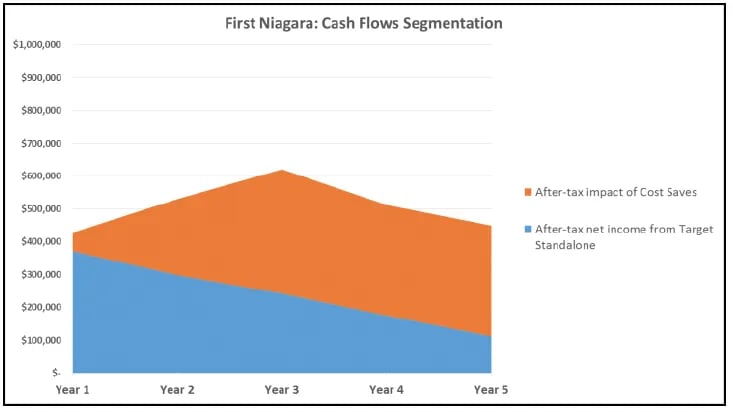
The next question is, what kind of annual returns could we see from this acquisition? Let’s break this down into three parts. Part 1 is the net income that KeyCorp can expect if it acquires First Niagara and does nothing with it. This means just letting the loans run down without replacing them or even creating a single new loan. Using our LoanLayering™ technology, we project that First Niagara’s loan portfolio would run down by about $6.5 billion over the next five years. As a result, we can calculate the net income that is already built into the existing assets. First Niagara’s annual net income is running a little shy of $300 million today. Assuming projected loan runoff without replacement, these earnings will decline over time to around $80 million in five years. See the projected cash flows below:
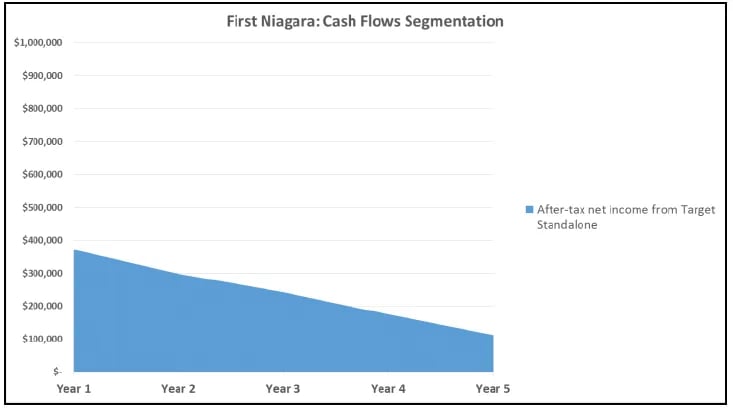
This is purely a theoretical exercise, but it’s important to recognize that KeyCorp is not buying a general ledger, it is buying a loan portfolio that is locked in for a certain period of time.
The next layer to the cash flows to consider is cost synergies. KeyCorp has estimated $400 million of annual cost savings. We calculated a conservative $330 million to capture some of the execution risk. Assume incremental after-tax income of $215 million in the first full year. After five years we would have close to $300 million of annual cash flows with little inherent risk, under good management.
The final layer is the incremental net income that would be created by replacing the loans that run off and by also replicating the loan growth that First Niagara could have achieved on its own. These cash flows are unique because KeyCorp has far more freedom to make changes to the composition, underwriting, and pricing of these loans. The interest income from these loans falls to the bottom line because we have already captured all interest expenses and non- interest expenses in the prior layers. If KeyCorp makes enough new loans to replace the runoff of the existing loans, and then makes additional loans to achieve a 3 percent annual growth rate (which is our estimate of what First Niagara could conservatively do as a stand-alone), the incremental impact to earnings is significant. By the end of the fifth year, this could mean almost another $280 million of annual net income.
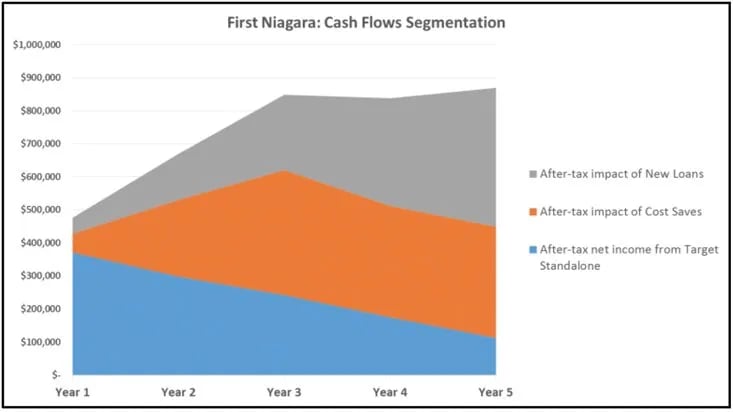
Although there is execution risk in this deal (some of which we already have captured), these cash flows would provide KeyCorp with an annual rate of return of approximately 17 percent. In this historically low-rate environment, where else could you get such a great return on investment with a similar investment – especially one of this size?
The key to understanding why this is a good deal is to recognize the construct of the cash flows documented above, plus the net outlay of capital when factoring in the target’s FreeCapital™. Without this layer of understanding, it’s easy to rush to judgment. But when you look below the surface, it’s a clear and attractive picture.
There are also strategic synergies that are difficult to quantify, but may significantly enhance the bank’s competitive position. The addition of First Niagara would enhance KeyCorp’s liquidity. Using a Basel III-style Liquidity Coverage Ratio metric, we see First Niagara with a higher proportion of stable deposits. Although First Niagara has incrementally larger proportions of brokered deposits, the 30-day disintermediation percentage to total deposits is below KeyCorp’s. Both banks also carry considerable investment portfolios. Both have considerable proportions of their respective portfolios pledged, and both have significant positions in agency-MBS pass-throughs. Making the combined portfolio more efficient relative to the amount necessary to support the pledges and maintain liquidity can have the impact of creating additional FreeCapital™ (and thus boosting returns further), depending on how the portfolio is managed.
4) KeyCorp could have paid as much as 2 times tangible book value for First Niagara and still have generated a better return on capital than strictly investing in organic growth.
It’s not that First Niagara is such a great bank – in fact, it has stubbed its toe more often than not in the last several years. It also operates in a low-growth market with limited upside. It’s more by default, but it is being rewarded for the timing of the sale. In a higher growth market with more attractive interest rates, organic growth would be a far better use of capital for KeyCorp, and First Niagara would be worth a lot less to it. So while the conventional thinking is that KeyCorp overpaid, we believe it could have actually paid more and still justified the transaction as an effective use of
This may sound crazy, but our model says KeyCorp could have paid up to two times TBV and still have gotten a reasonable deal. As an example of our Customized Ceiling Price calculations, let’s return to the Residential Real Estate 1-4 Family portfolio. In that analysis, we determined that the gross return on capital from the acquisition at the announced deal multiple was 86 percent compared with 75 percent for organic growth. If we increase the purchase price to the point where the acquisition return equals the organic growth return (75%), we get a Customized Ceiling Price of 1.99 times TBV for this particular loan portfolio in isolation. (It is crucial to understand that the Customized Ceiling Price calculation is individual for a unique buyer, a unique seller, and a projected organic growth economic environment.)
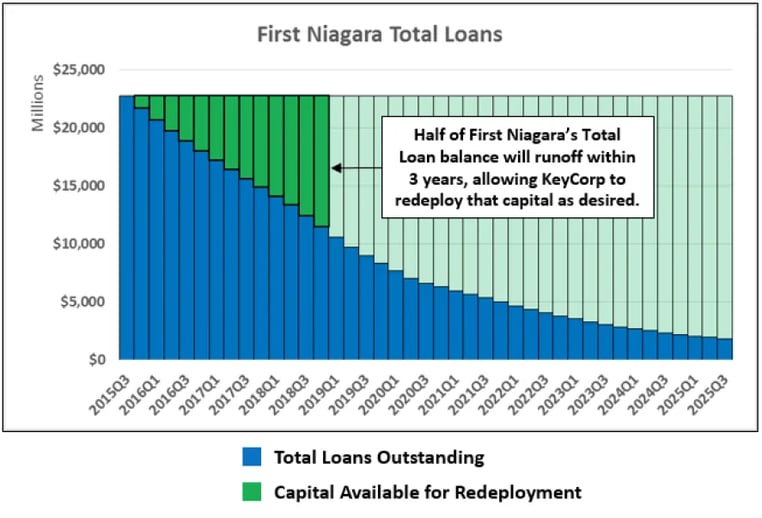
5) The projected HalfLife™ of First Niagara’s key loan portfolios provides KeyCorp with a nice balance of longevity and freedom to change the mix of the portfolio.
In point #3 above, we talk about the third layer of the cash flows that KeyCorp should be able to generate from First Niagara’s platform. This third layer is essentially the incremental earnings created by new loans originated after the transaction. These new loans would replace the runoff of the existing loans while also achieving the projected loan growth that First Niagara would have likely achieved on its own. This layer of cash flows will be very attractive because KeyCorp will have far more control over these than the cash flows it inherits from non-maturing loans. The layer is small enough that there is little risk to KeyCorp if First Niagara’s customers rush for the doors at renewal time. We have a metric we called HalfLife™, which measures the number of quarters it will take for exactly half the loan portfolio to run off. In this case, the HalfLife™ is 13.2 quarters. This is an attractive number because it’s not too long, allowing KeyCorp to make changes to the portfolio’s composition and underwriting. At the same time, it’s not too short, where KeyCorp blinks and half the loans are gone.
Conclusion
KeyCorp is pushing this deal primarily as a cost savings initiative. It is likely doing so to justify the financial aspects of the transaction to analysts and investors who are relying upon incompatible and outdated models that focus too much on issues such as dilution to tangible book value. One of the major analysts who covers the stock even wrote that “bank M&A is almost always about creating operating leverage from expense savings and secondarily expansion into better growing markets.” We have respect for this analyst, but we strongly disagree. When we use our analytics, what we see is a very smart deployment of capital into under-rated assets that have a far better risk/reward trade-off than anything available organically in the market. KeyCorp is also improving its competitive and strategic positioning in these markets through this deal – something that is very difficult to quantify.
Overall, this deal should not be roundly criticized. In fact, we think KeyCorp paid a very reasonable price given current economic conditions. The key phrase here is “given current economic conditions.” In a normal economic environment, which is not the case today, this deal probably does NOT make sense at the price that KeyCorp paid. In this environment, average deals become great deals by default because the risk/reward trade-off off organic growth or doing nothing is so bad. If you believe that interest rates will increase significantly AND we will have a prosperous and growing economy over the next several years, then this is indeed a bad deal and KeyCorp would have been smarter to focus instead on aggressive organic growth. Unfortunately, this outlook is wishful thinking. In today’s economic and regulatory environment, more banks should be looking at these types of deals to generate an attractive return on capital for its shareholders, and investors and analysts must stop looking at bank deals through pre-recession glasses.
Note: Invictus Consulting Group does not have any relationship with either KeyCorp or First Niagara. This article is not intended as investment advice or as a recommendation, and Invictus is not responsible for any investment decisions made by anyone who reads it.
For further information or to schedule a presentation, please contact Invictus Managing Partner and National Sales Director George Dean Callas: Phone: (718)-219-0441 | Email: gcallas@invictusgrp.com