
1. Domestic deposit growth in the banking system was at its lowest level since the 2008 financial crisis.
In 2018, the total amount of deposits only grew by 4.4 percent. And this was in a year in which GDP growth was its highest in 10 years.
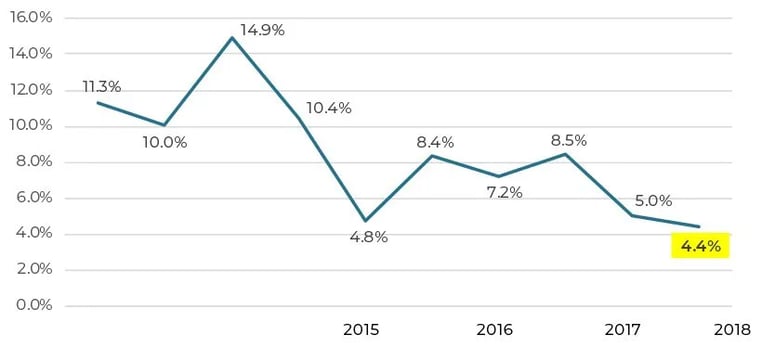 The likely explanation for the slow growth is the impact of QE reversal, which started in 2017. Although the Fed is signaling to the market that it may take its foot off the gas in terms of unwinding the balance sheet, the general market expectation is that the Fed will unwind another $500 billion and then stop. However, it has only unwound roughly $500 billion, so we are only half way there under a more gradual plan if there even is one! More pain is likely to come.
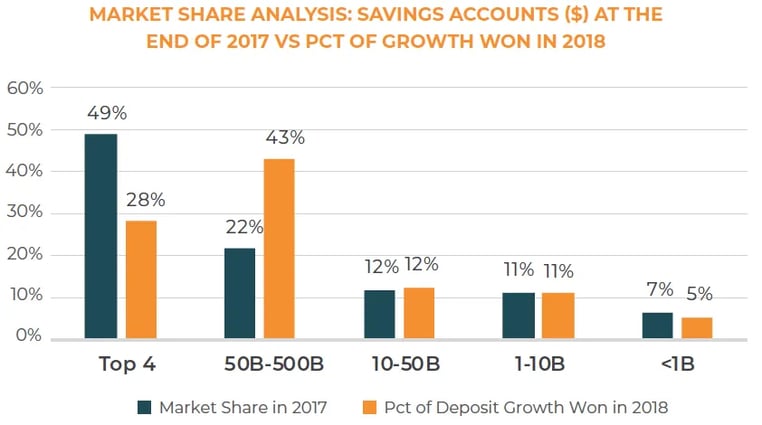
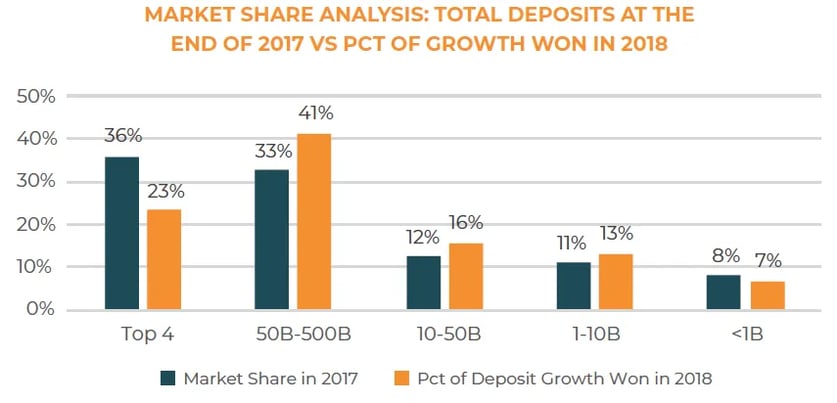
2. In terms of growth in total deposits, the super regionals (banks with $50 billion to $500 billion in assets) fared the best, while the four largest money center banks generated the fewest gains.
There was $533 billion of deposit growth in 2018. The super regionals won 41 percent of that growth, a disproportionate amount relative to their market share of total deposits at the end of 2017. The four largest money center banks (JPMorgan, Bank of America, Citibank, and Wells Fargo) lost market share in 2018, but this is not a good sign for community banks, as we’ll soon explain. Regional and community banks ($10 billion to $50 billion in assets, and $1 billion to $10 billion in assets) appeared to do okay by winning more of the growth relative to their overall share at the beginning of the year, while the smaller community banks (those with less than $1 billion) slightly lost traction.
 So, what do these numbers mean? We know that the four money center banks have massive competitive advantages over the rest of the banks, including the super regionals. It would be an apocalyptical mistake to read the Market Share Analysis chart and conclude that the top four banks are losing the war on deposits. These four banks benefitted the most from QE during the recovery, so they were also the most negatively affected by QE reversal, which picked up steam in 2018. In other words, they are like prize fighters who withstood onslaughts by opponents in the first round. They may have lost that round, but after feeling out their competition, they are now ready to launch their own attack. For example, JPMorgan Chase announced a massive branch expansion plan at the end of February.
3. Despite losing a disproportionate amount of the total growth in deposits, the top four banks dominated the growth in the transaction accounts – the highest quality deposit product.
This may be the proof that the largest banks already are winning the war. Of the $533 billion of total deposit growth in 2018, only $59 billion of it came from growth in transaction accounts. However, money center banks grew their transaction accounts by nearly $68 billion, so they cleared the market for transaction accounts AND took market share away from the other banks!
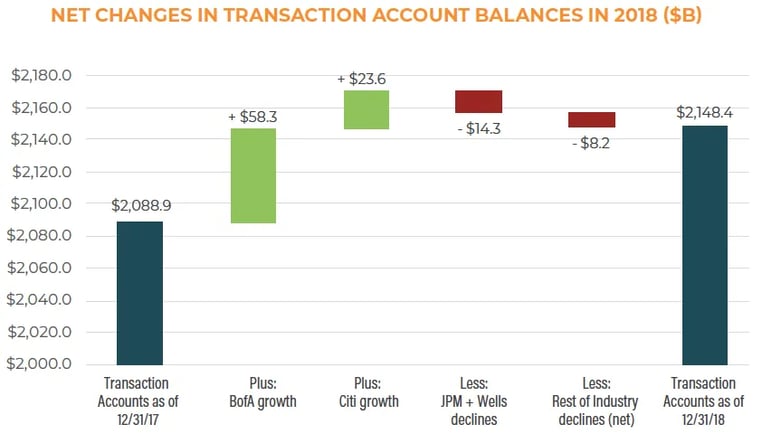
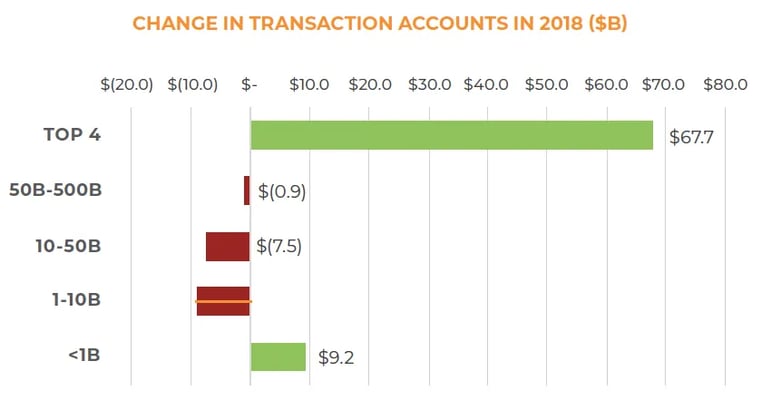 It is worth clarifying that all the growth came from two banks: Bank of America (+$58 billion) and Citibank (+$24 billion). JPMorgan Chase (-$6.5 billion) and Wells Fargo (-$7.7 billion) lost transaction account money in 2018.
 Although growth in transaction accounts only accounted for 10 percent of the total growth in deposits in 2018, the poor performance of the regional and community banks in the middle asset size tiers is alarming. Amazingly, the under $1 billion in asset-size community banks were the only other group to grow transaction account balances in 2018. We are not sure how to explain that, but one guess is that many of these small banks operate in rural markets where they are the only game in town and are more focused on battling the credit union across the street.
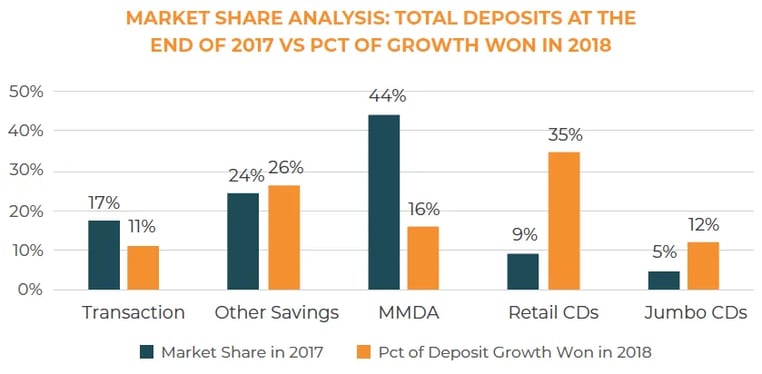
4. The increase in deposit growth is becoming unhealthy. It is moving away from transaction accounts and skewing toward CDs on a ‘pound for pound’ basis.
The mix of deposits is clearly changing. Transaction accounts and MMDAs significantly underperformed their share of total deposits exiting 2017, when looking at their share of the total deposit growth in 2018. Meanwhile, retail CDs took nearly a four-time-multiple of its share of the growth, and jumbo CDs also grew at a disproportionate rate.
 The underperformance of MMDAs was very surprising. Once again though, we need to dive in further to see what’s really going on. See the next trend.
5. Community and regional banks are increasingly relying on MMDAs to grow their deposits, but the largest banks are ignoring them.
Total growth in MMDAs was $85 billion, which is 16 percent of the total $533 billion in 2018. Most of that growth went to the banks in the middle tiers.
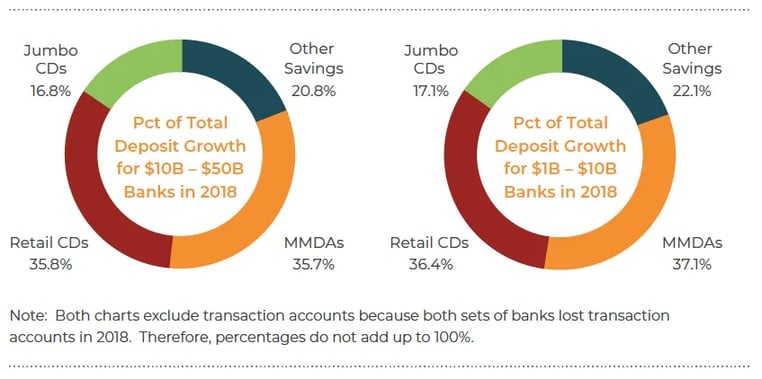
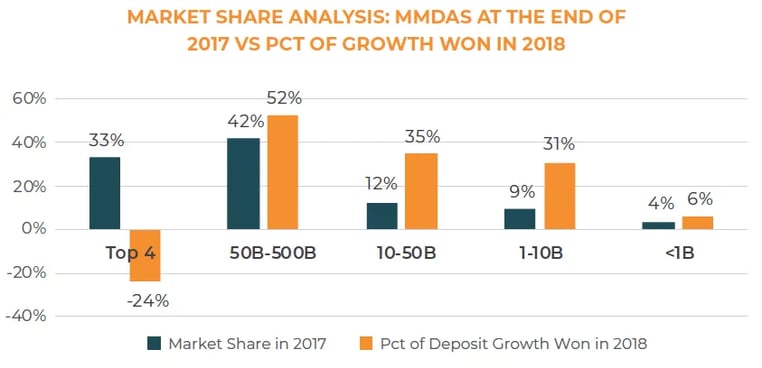 The top four banks lost the most ground in MMDAs. While it appears the super regionals cleaned up here, this is highly misleading. If Charles Schwab is removed from the group, the super regionals actually lost MMDA market share in 2018. In fact, Schwab grew its MMDAs by $62 billion in 2018, which is 73% of the growth for the entire industry! TD Bank was also a top performer in MMDAs ($10.3 billion of growth), which likely can be linked to Ameritrade. A new and disturbing trend relative to how money sitting at brokerage accounts will be swept into bank accounts has emerged, so some of this money is making its way into the larger banks as a deposit, but at a much higher rate, similar to brokered deposit rates. The major point here is that the community and regional banks are heavily relying on MMDAs to drive the little deposit growth they are generating, as this chart shows:
 This is concerning. CDs are obviously more price sensitive and expensive, but the significant increasing reliance on MMDAs is not that healthy, either. MMDAs are essentially a parking lot for large sums of money looking for a permanent home. Individuals and institutions use MMDAs to get better yield than savings accounts without the maneuverability restrictions. The problem for community banks is the increased depositor awareness of rates as we move from a prolonged extremely low interest rate environment. This money could very easily leave for a more permanent home in CDs, either in the current bank or at another institution (which we call intra-disintermediation). Alternatively, the deposits could move to other asset classes outside the bank if these customers have increasing confidence that rate hikes will pause (disintermediation). This is a very dangerous game for community banks to play. At least with CDs, you secure a time commitment from the borrower.
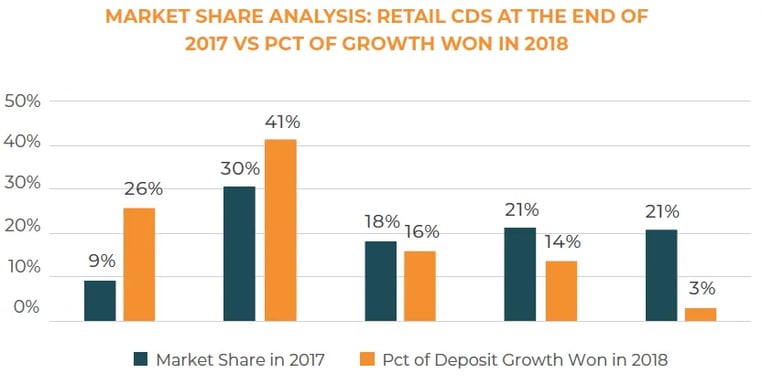
6. The Retail Time Deposit market is becoming quite the battleground.
As mentioned in Trend #4, Retail CDs were the most popular product for new deposits in 2018. They wildly outperformed their market share contribution coming out of 2017 (35 percent versus 9 percent respectively). The largest banks and super regionals are cleaning up, with both groups winning a disproportionate amount of their share of the growth relative to 2017-year end levels.
 Within the top four largest banks and Super Regional groups, the winners in 2018 are concentrated in a handful of banks, led by Wells Fargo, which is probably trying to compensate for its lost ground on transaction accounts (see Trend #3 above):
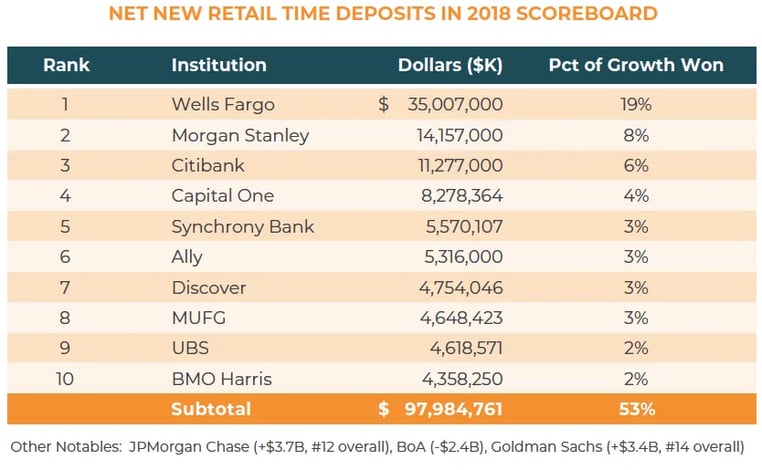 We are also seeing digital-centric institutions such as CapitalOne, Synchrony, and Ally Community banks do well in 2018. Community banks were underperformers here. The $1 billion to $10 billion group only won 14 percent of new retail time deposits even though they had 21 percent of the total market share entering the year. The under $1 billion group really got demolished, winning only 3 percent of the new market, despite entering the year with 21 percent of all retail time deposits. Expect this trend to continue, if not exacerbate in 2019, given the significant competitive advantages the larger institutions have over the community banks in areas such as digital, adverting spend, and market analytics.
7. The Super Regionals took market share from the top 4 in Savings Accounts, while the community banks retained their share without much gains or losses.
Savings accounts were the most stable deposit product in 2018. They represented 24 percent of total deposits outstanding in 2017, while garnering a similar 26 percent of net new deposits in 2018. However, the super regionals, led by Capital One, PNC, Goldman Sachs, and Ally, took market share away from the top 4 banks because gains by Wells Fargo and JP Morgan Chase were offset by losses from Bank of America and Citibank.
In our opinion, we think this category of deposits represents the biggest threat to community banks in 2019. While they held ground in 2018, the larger banks are starting to jack up their rates on savings accounts to a point it is starting to blur the lines in rates relative to MMDAs and retail CDs. For example, Goldman Sachs Marcus (ranked #7 in Savings Account growth in 2018) is offering a savings account with no minimums at 2.25 percent APY, which is only 50 bps lower than the high yield CD its offering at 2.75 percent APY. Other online banks such as Synchrony and Ally have similar offers on savings accounts. The trend in terms of who will win the savings accounts up for grabs in 2019 may look like the scorecard for retail CDs in 2018 (see Trend #6).
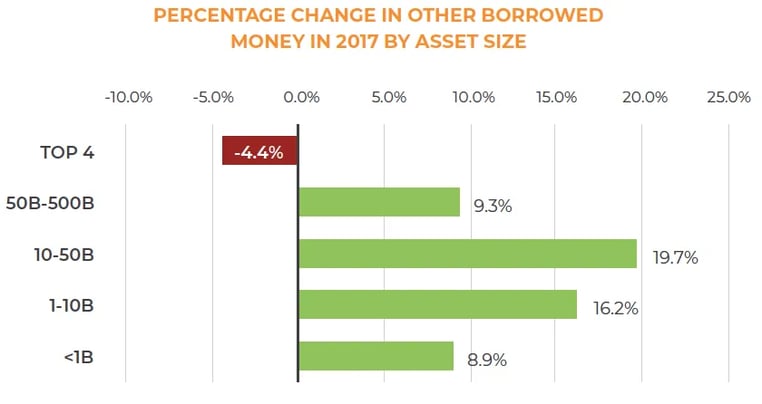
8. Despite the pressures on deposits, non-deposit sources of funding such as Fed Funds, Repos, and FHLB borrowings were slightly down in 2018.
Community banks in particular were not increasing their reliance on these funding sources in 2018:
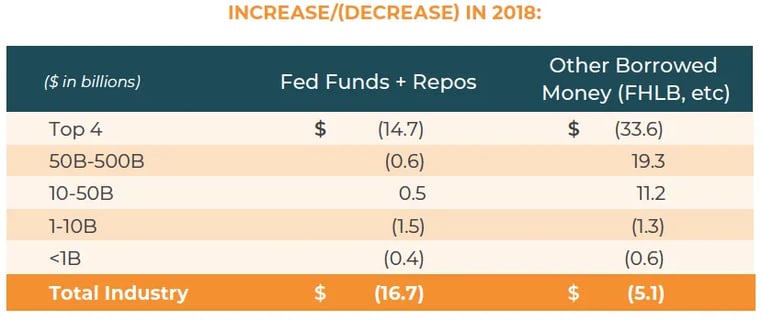 The second and third-tier banks by asset size were exceptions to this trend. We were curious why these numbers did not increase, so we tested the following hypothesis: Community banks had already tapped into these funding sources, thereby leaving little capacity remaining to rely on them further. This led us to check out the flows of these funding sources from 2017, the prior year, and here is what we found:
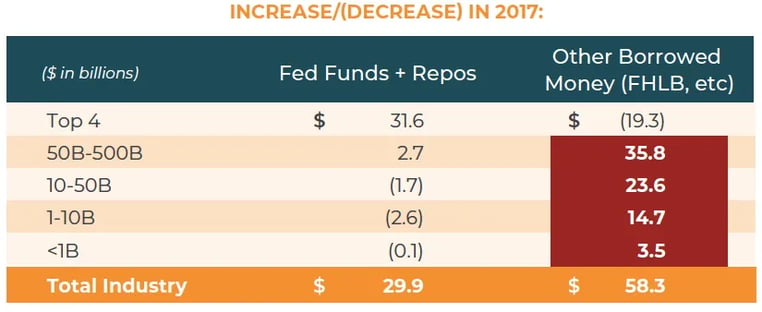 Over $88 billion (the sum of the two totals in the chart above) of funding came from these sources in 2017, which was 15 percent of total deposit growth that year. When looking at the year-over-year growth rates versus 2016, you can see how dependent community banks were on these sources:
 9. The smallest community banks experienced the lowest increase in the average cost of funds in 2018.
Last October, we talked about how banks in need of deposits should look in ‘lower growth’ markets. In a nutshell, these banks have strong core deposits and low LTD ratios. As a result, they should be able to absorb rate increases better than most banks. In 2018, this was exactly the case:
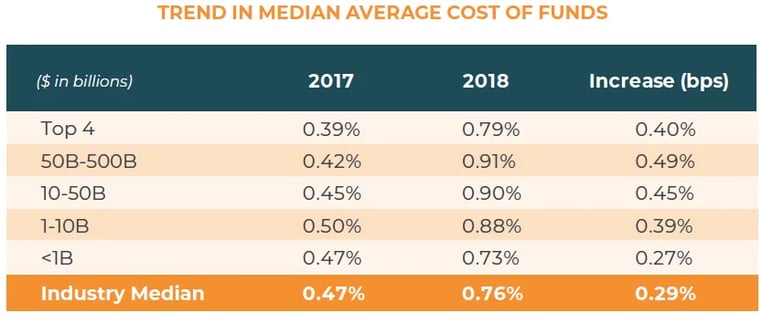 The under $1 billion group of banks experienced the lowest increase in their cost of funds and have the lowest average cost of funds overall. Remember, they were the only group outside of the top 4 to also experience growth in transaction accounts (see Trend #3 above).
Banks in the $1 billion to $10 billion group with high LTD ratios that are not aggressively looking to acquire banks in the under $1 billion group simply because of the lack of market sexiness are making a mistake.
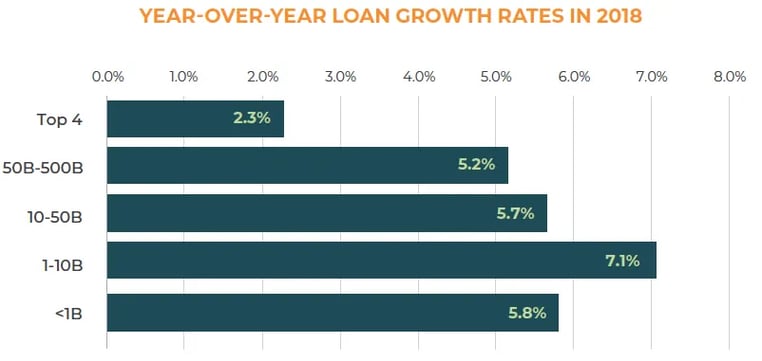
10. When we look at the relationship between deposit growth and loan growth, the funding pressures on community banks between $1 billion and $10 billion becomes apparent.
Lots to unpack here. First, let’s look at loan growth rates in 2018, which we have normalized to adjust for the impact of acquisitions. Notice the level of aggression by the $1 billion to $10 billion class and the lack of aggression by the top 4 banks. One must ask what the top 4 banks know from the standpoint of credit risk that the rest of the market does not, but that is not the subject of this paper.
 For the entire industry, a total of $434 million of net new loans were made in 2018. If we compare this to the $533 million of deposit growth experienced by the industry, that means the incremental LTD ratio was 81 percent in 2018. This ratio feels normal and good, but when we break it down by asset size, we see a different story:
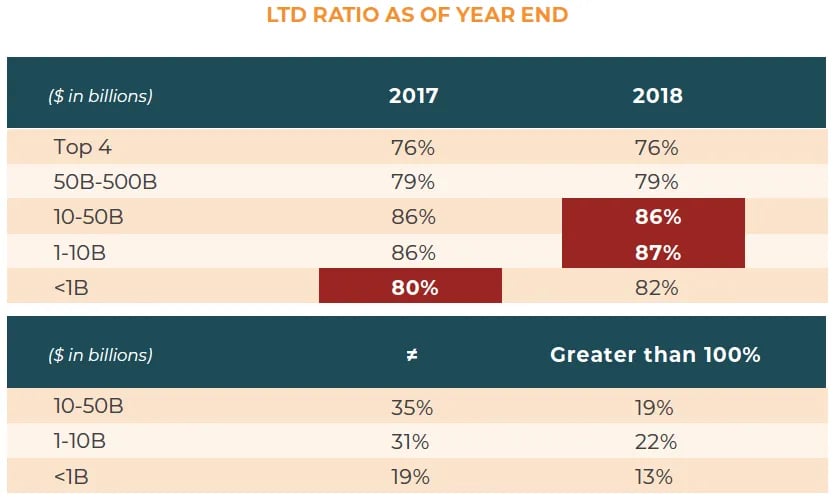
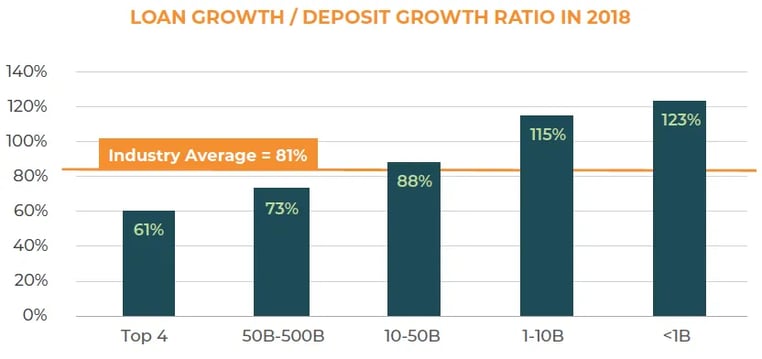 We are not as concerned about the under $1 billion group. Even though their incremental LTD ratio is high, they had far more capacity to fund loans using excess deposits on hand entering 2018. We can see this in the overall LTD ratio for both 2017 and 2018:
 The $10 billion to $50 billion and $1 billion to $10 billion banks have the highest LTD ratios. The year-end averages may not tell the entire story. If we look at the percentage of banks with high LTD ratios, it’s 54 percent of both groups versus only 32 percent for the under $1 billion group:
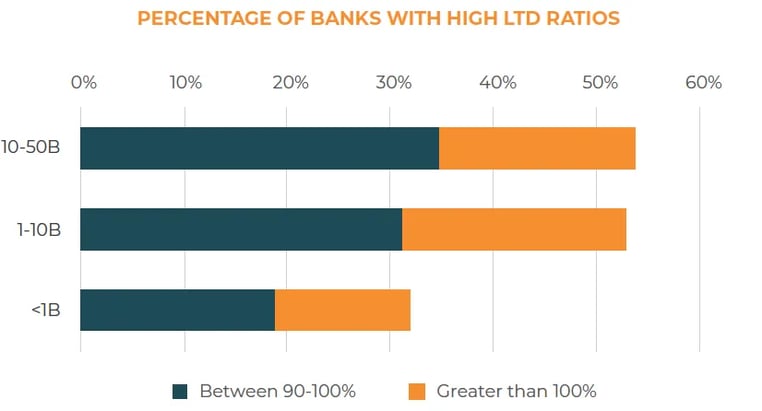 The bottom line: many community banks are not funding their loan growth with new deposits. They are pushing the limits in terms of what their balance sheets can support. This is highly unsustainable, and something will have to give very soon.
Conclusion
The deposit flows in 2018 are not encouraging for community banks. The more we peel back the layers of the onion, the more exposed they become. Even if the Fed pauses on additional rate hikes and discontinues balance sheet normalization sooner than expected, deposit troubles for community banks as a group will get worse, not better. The deposit pie is not growing enough, and the growth is not healthy growth. The only thing that might change this is if the Fed once again decreases interest rates and restarts QE. But if the Fed does that, it would be for one reason: we would be headed into a recession. And that scenario would be even worse for community banks, with added credit risks just as they transition to the new CECL standard. The only practical solution for those community banks with high LTD ratios is acquisitions. At minimum, the acquisition of a bank with the right profile provides insurance against a liquidity crisis and can offer new fuel to drive loan growth and earnings while other banks struggle with tapped-out balance sheets.