
Community institutions have reinvented themselves in the last eight post-recession years. Between the capital losses of 2008 and 2009, increased regulatory constraints, an extended slow recovery and the unprecedented low interest rate environment, senior executives have faced and overcome challenges of an exceptional nature and magnitude. Yet they have accomplished this, in most cases, without analytical systems that can quantify, analyze and project the impact of the aforementioned changes.
Due to the limitations of legacy analytical and reporting systems, all their actions have been defensive and reactive, rather than offensive and proactive. Unfortunately, there are serious issues facing community institutions that have been bubbling just below the surface and are due to see the light of day in the upcoming years. These issues will affect practically every community institution, regardless of its profitability.
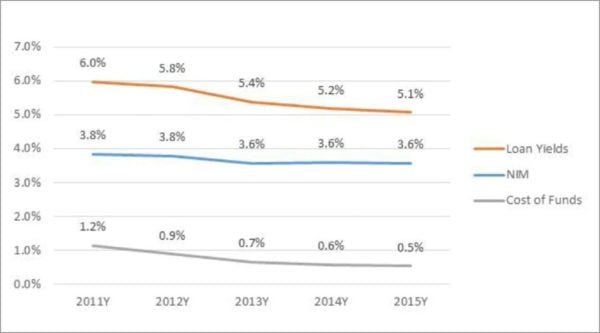
Traditional analytics and financial reporting show that practically all community institutions are facing some level of earnings compression. For example, most of these systems indicate a fairly slow but steady decline in gross yield on assets, with this decline historically offset by steady or marginally improving net interest margins (see Figure I on following page). Traditional extrapolation of these results would indicate a shallow but slightly declining trend in community institution earnings. The response to this dollar earnings compression has been – and continues to be – an increased emphasis on organic growth.
Figure I: Yields and margins – all U.S. banks under $10 billion
Unfortunately, these historical financial statements and existing pro forma models are repeating the errors of the pre-recession world. The assumption that historical trends can simply be extrapolated based on recent history is wrong. Even worse, it is masking the underlying turbulence that is about to strike the community banking market. It is only when one breaks down and quantifies the components and patterns that affect gross loan yield and the different timing patterns affecting the cost of funds (deposits) that one can measure the magnitude of the problems bubbling just below the surface.
To best illustrate and quantify these potential problems, it is important to first review the community institution market’s post-recession performance, using appropriate analytics that take into consideration the considerable impact of monetary policy.
As illustrated in Figure II, which shows the prime rate since 1990, interest rate troughs are not a new phenomenon. However, the present trough, created by post-recession monetary policy, is unprecedented in not only its depth but more importantly in its extended duration – it has lasted long enough to influence more than 80% of existing loan portfolios.
Figure II: Bank Prime Loan Rate (monthly, not seasonally adjusted)

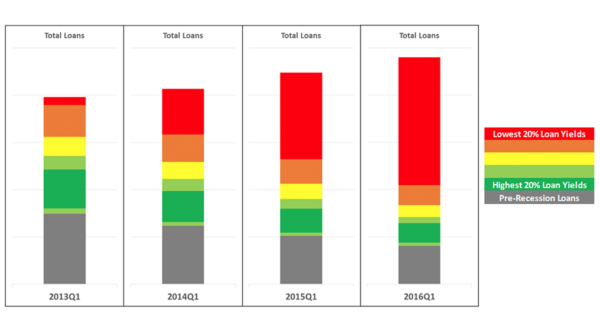
Meanwhile, Figure III below shows the distribution of loans for every community bank in the country by gross loan yield based on loan vintage for the past four years. One can clearly see the increased “poisoning” of the balance sheet as higher-yielding loans continue to run off the banks’ books and are replaced by lower yielding “trough” loans. As is evident from these graphs, there has been a steady decline in gross loan yields across the community banking system. Ongoing organic growth will continue to make this situation worse.
Figure III: Distribution of community bank loans, by gross yield based on vintage
So what does this all mean? In spite of this increasing poisoning of loan portfolios (declining gross yields), the actual net interest margins (NIMs) and profitability declines have not displayed a corresponding deterioration.
Traditional analytical tools and accounting systems indicate increased pressure on NIM spreads and net profits, but they do not even approximate the magnitude and rate of decline in gross yields. As noted, extrapolation of these trends using legacy tools would merely show a shallow slope to this deterioration that could be easily mitigated by an eventual uptick in interest rates.
All the while, analysts and shareholders are pressuring bank management to increase dollar earnings. Their solution is increased asset growth, and that is actually part of the problem. Bankers are flying blind by relying on outdated analytics, as illustrated in Figure IV, wherein the cost of funds is superimposed on the gross yields chart from Figure III.
Figure IV: Distribution of community bank loans, including cost of funds
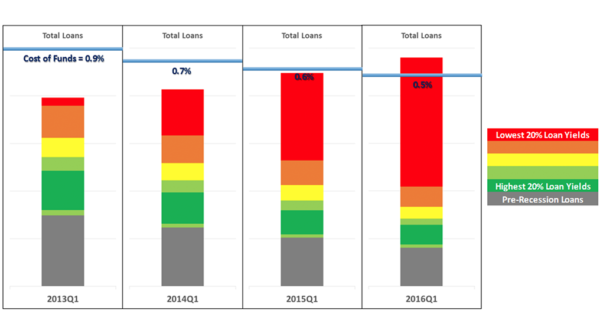
As one can see, the decline in gross loan yields has been effectively offset by a corresponding decline in the cost of deposits resulting in a net, albeit relatively minor, degradation in bank net interest margins. An institution using traditional analytical processes and accounting methods would assume that increasing asset volume is a partial but seemingly effective solution to the degradation in dollar earnings, but this approach is dangerous. It is actually like steering the ship directly into the reefs.
Appropriate analytics provide far greater clarity. Consider the following two critical facts:
- As pre-recession and pre-Bernanke-era loans (with their higher yields) run off the bank’s books, they are replaced by post-Bernanke-era low-yielding loans. All incremental growth is also booked at these low rates. Each year the percentage of pre-recession and pre-Bernanke-era loans (with their higher yields) decreases at a fairly rapid rate, while new and replacement loans (with low gross yields) continue to grow as a percentage of the total portfolio.
- Historically, the post-Bernanke deposits continued to follow the same pattern, with rates declining across the deposit base. However, the near matching decline in deposits has, year to date, positively affected the funding of the entire asset portfolio (pre-and post-Bernanke). As a net result, the net spreads of the declining, but still present on the books, (pre-Bernanke) higher-yielding portfolios has widened, largely compensating for the new and replacement loans written at the post-Bernanke depressed rates. This is extremely important.
Unfortunately, the stage is now set for this process to reverse itself, a reversal that is far from evident if one were to rely on traditional financial statements and legacy forecasting systems.
Deposit rates have now plateaued close to their lowest possible level. As a result, the compensating increasing spreads in total loans has come to a grinding halt.
The higher-rate pre-Bernanke loans will continue to amortize fairly rapidly, continually being replaced by low-gross-yielding market loans. The net effect of this ongoing reduction in total portfolio gross yields and plateaued cost of funds will have a massive and cumulative impact on bank profitability and returns in the next few years.
This impact will be dramatically different than what trends extrapolated using legacy analytics and bank financial accounting statements suggest. Banks that do not recognize these key trends and take appropriate action immediately will be left in fairly dire straits.
A rising interest rate environment will make the situation even worse. The cost of all deposits will increase very rapidly, while loan portfolios will turn over at a far slower rate, further compressing spreads. It goes without saying that recent and near-term organic growth substantially increases the amplitude and duration of these previously undiscovered negative trends.
Mergers and acquisitions, then, may offer the best solution – as long as banks use proper M&A analytics in their deliberations.
Picking the Right M&A Target
Most community banks rely on traditional M&A analytics based on historical data that fail to take into consideration the very economic and regulatory factors causing distress. As a result, these legacy analytics and their underlying logic fail in identifying and pricing the best targets a bank should pursue.
Proper methodology and analytics are required to identify, price and consummate transactions that will help community banks mitigate the negative pressures created by current economic conditions and monetary policy. Pro forma statements generated using traditional methodologies often provide misleading results. Let’s look at the difference in results between traditional reports and those that use vintage analytics, taking into account when a loan was originated.
The methodology of generating a target’s pro forma is generally the same as it was in the 1970s, yet much has changed since then in banking. Using these outdated techniques completely ignores the recession of 2008, the post-recession economic gyrations that affected probabilities-of-default and loss-given-default, and most importantly, the continuing, unprecedented monetary policy that has artificially lowered interest rates.
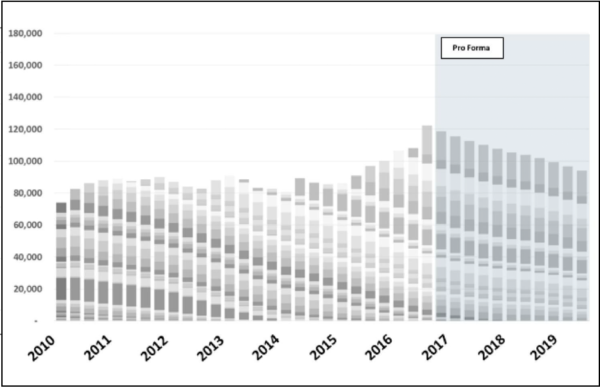
Figure V, showing outstanding quarterly loans, is a simplistic yet realistic depiction of the prevailing methodology in use by analysts, investment bankers and accountants in the community banking market. As the chart shows, in an effort to focus on “expected performance,” there is an undue emphasis on more current loan yields and trends. As a result, the target bank’s performance in “older” years is completely ignored. This is unfortunate, as the resulting performance metrics are not only inaccurate but also grossly misleading.
Figure V: Outstanding quarterly loans
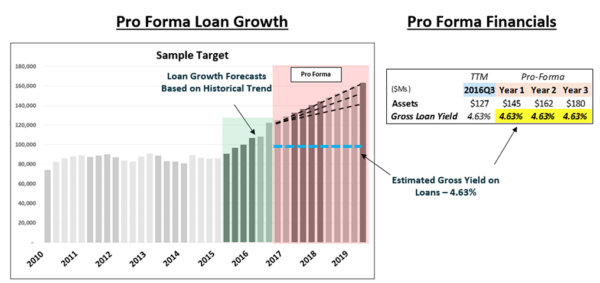
For practical purposes, the chart in Figure V above seems logical. It shows projected growth trends consistent with recent history and an estimated gross yield based on the most current financial data. This gross yield is then extrapolated for the balance of the projected period. In reality, this approach serves only to mislead acquiring management’s focus and direction. The flaws become evident when “vintage analytics” are utilized in analyzing potential targets.
In Figure VI, for example, the vintage layers that constitute the successive quarterly loan balances as the portfolios age are segmented out. This allows an appropriate focus on the new/refinanced loans underwritten each quarter and, equally importantly, their progression since origination.
Figure VI: Loans by vintage
As can be seen in the chart, the latest outstanding loan balance will cascade down over time based on the inherent maturities/repayments built into the loan portfolios. The slope of this “net loan outstanding” level is different for different banks and has a critical impact on that bank’s future performance, profitability and loan level sustainability.
Now examine what happens in Figure VII. The “vintage analytics” start to incorporate gross yield rates into each of the vintage segments based on prevailing interest rates at the point of origination. This process accurately estimates the gross yield distribution across each quarterly total loan portfolio, in segment and in total. The amortization built into the segments allows an extrapolation of these portfolios into the future, with each pro forma quarter reflecting its unique yield distribution and resulting net total gross yield.
Figure VII: Incorporating vintage characteristics
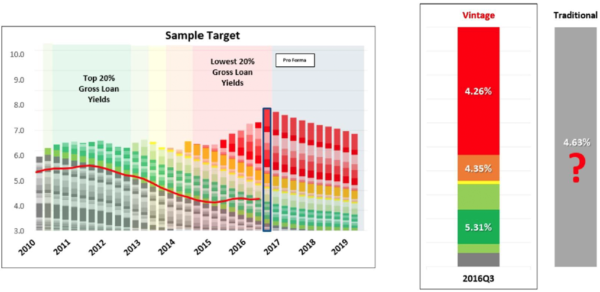
Interest rates on loans are determined by competition in the market at the time of origination. The prevailing rates in each historical period are estimated to quantify the yield contribution of each loan in the portfolio. The bands are colored to indicate periods when rates were relatively high (green) or low (red).
The chart above creates the foundation for a pro forma system that is not only far more realistic and accurate but, as will be evident from the charts in Figure VIII that follow, produces radically different results than the prevalent legacy analytics.
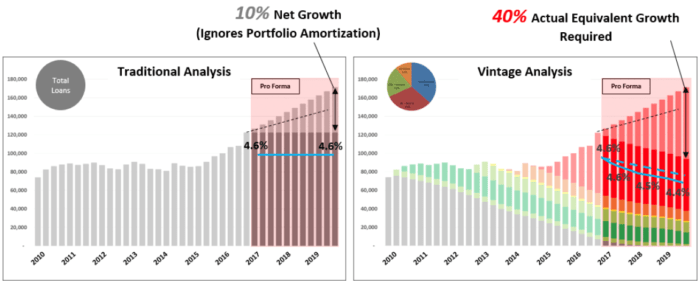
Figure VIII: Traditional versus vintage analytics
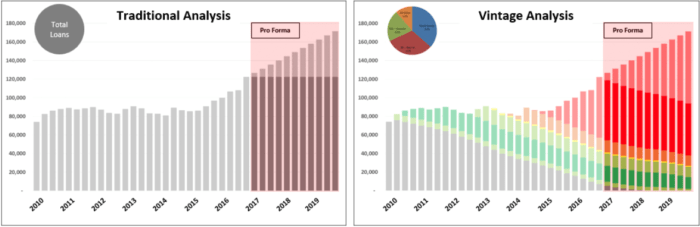
The yield, risk, and amortization schedule of loans differs by loan type. Each portfolio should be assessed individually and then aggregated together to forecast total loans.
As is evident from the above charts, implied growth rates in the traditional analysis ignore the amortizations built into the target’s portfolio. Given the wide variances between different target banks, this portfolio runoff is critical when evaluating what is truly being purchased in an M&A transaction. A question to ask your investment banker: Is this data being captured?
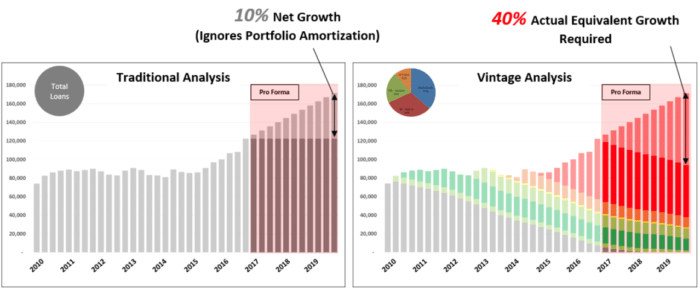
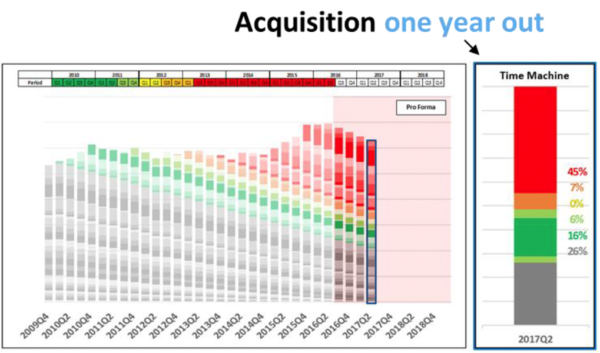
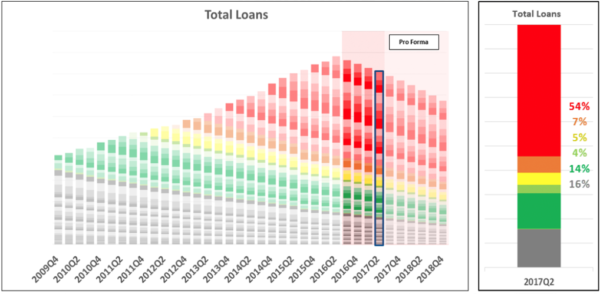
Look closely at the next vintage analysis chart in Figure IX. It highlights and quantifies the reality built into every single bank’s portfolio. Loans have been color-coded in 20 percentile bands that reflect their gross yield based on prevailing interest rates at point of origination. An examination of the vintage analysis chart during the pro forma period shows that higher-rate loans originated during the 2009-2013 periods are running off rapidly. These higher, gross yielding loans continue to be replaced with “red” loans done at prevailing/expected low rates. The refinanced loans coupled with organic growth at these low rates continue to further drive down gross yields.
Figure IX: Traditional versus vintage analytics, part II
The bottom line is that a very different pattern in pro forma gross yields emerges when comparing the traditional analytics and those that use vintage. Legacy analytics have no basis or logic for adjusting pro forma gross yields, so they tend to project a constant based on the target’s current assets. This produces misleading results. The vintage analytics consider this critical factor, allowing the acquirer to truly evaluate the potential value of the assets under consideration.
The takeaway from all of this: Know what you are buying.
How to Measure the Value of the Loan Portfolio
A community bank’s most capital-intensive and strategic decision is a merger or acquisition. It has instantaneous operating and financial implications, ultimately measured by the impact on the acquirer’s return on capital. But that’s not the entire story. For the results to be truly meaningful, an acquisition’s impact has to be measured in the context of its alternative – namely, organic growth.
Any other methodology is incomplete and misleading, since it is an analysis done without any contextual reference point. And that means it grossly misrepresents the acquisition value because the consolidating forecast establishes a zero baseline as a reference point for valuation. In reality, this baseline is usually positive or negative, depending on existing and expected market prospects. Furthermore, this process ignores the selective and individual impact of the acquisition on key driving variables that eventually justify any price in excess of the target’s existing book value.
The most commonly used transaction analyses make this mistake, relying heavily on standalone and consolidated forecasts. Beyond being wrong, these analyses can lock in unpleasant surprises for senior management after the combined entity’s first year of operations.
A very simple example of distorted analysis is the prevailing use/reference/promotion by investment bankers of historical book value multiples. Every CEO contemplating an acquisition or a sale has had a report from an investment bank outlining a series of “historical comparable transactions.”
There are two patently absurd assumptions built into the use of these multiple-of-book charts. First, they assume that these were properly priced transactions that can be used as a standard reference. Secondly, they assume that these transactions are comparable even though they took place in very different operating and economic environments. Unfortunately, once the transaction is completed and the fees paid out, CEOs are left to live with the results and consequences of the transaction, no matter the multiple-of-book value.
The vast majority of CEOs have the knowledge and experience to properly evaluate M&A transactions provided they have access to the proper methodology, data and analytics. But they must be willing to stop being manipulated by antiquated and illogical methodologies and rules of thumb.
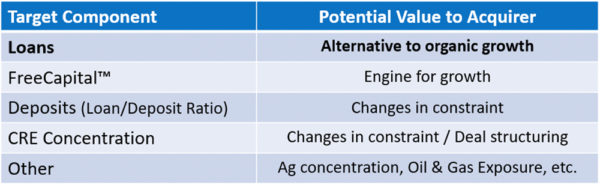
There are several different value propositions involved in an acquisition that would justify/contribute to the multiple paid over book, taking into consideration the acquirer’s existing and expected environment. Figure X shows several components of a selling bank which could add value to or detract value from a potential acquisition, but we’ll focus mainly on the loan portfolio.
Figure X: Components that impact value in a potential acquisition
The following conceptual step-by-step analysis shows bankers how to estimate the acquisition target’s loan portfolio contribution to its book multiple.
Step 1: The target’s loan portfolio is extrapolated (conservatively – no growth/replacement) over 12 months. This provides the gross earnings that would be generated by the acquisition loan portfolio and the size and composition of this portfolio at year-end. The size of outstanding loans after one year of amortization then establishes the targeted level of baseline organic growth.
Step 2: The acquirer’s loan portfolio is allowed to amortize (with no growth and replacement) over the one-year period.
Step 3: A steady growth rate in loans is superimposed on the acquirer’s loan portfolio, accumulating in an incremental volume level that equals the outstanding loan level of the acquisition after one year of amortization. The acquirer will end up with the same amount of assets in the one-year period in both the acquisition and organic growth scenarios. This process establishes an equivalent baseline of organic growth to evaluate the proposed acquisition. It also considers the time value of money, which is a real tangible consideration when evaluating an acquisition. The expected rate environment is a critical part of this step.
The acquirer must also recognize market conditions for loan originations. The sample acquirer assumes new loans will be originated at current market rates (represented by the red shading). The bar chart depicts the bank’s portfolio after a year of growth, including both existing loans and new originations.
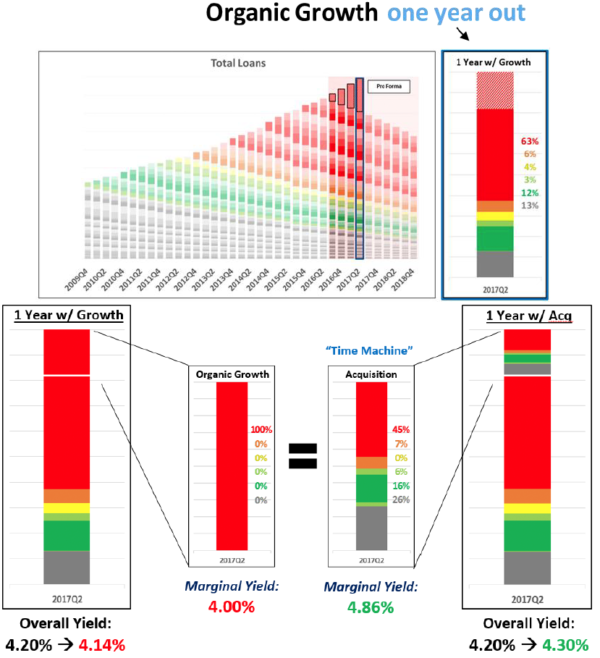
Note: The amount of organic growth implied in this step might not be practically realistic; however, it must be matched to the acquired loans outstanding at the end of one year to establish the correct baseline. Obviously, this is conservative, but we believe this conservatism is necessary in any acquisition evaluation.
Step 4: Calculate the gross yield generated in the organic growth scenario, taking into consideration the monthly/quarterly outstandings and yields of the loan portfolio and the expected yield of this organic growth over the pro forma period. This then allows for the calculation of return-on-capital over this period. This process is repeated with the acquisition being treated as a simple dollar-for-dollar purchase of assets with no implied purchase multiple.
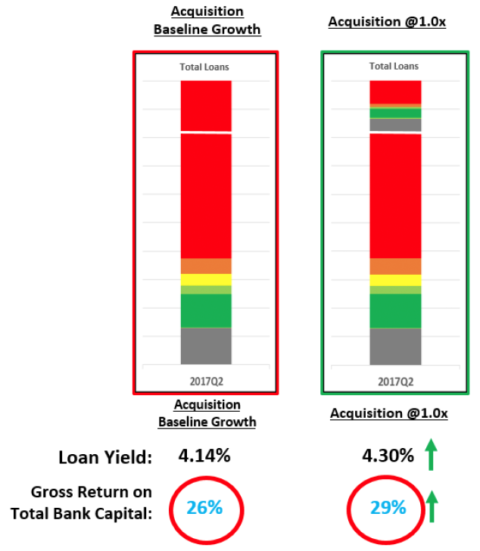
Step 5: Once the implied return-on-capital for both scenarios have been calculated, it is a fairly simple matter to calculate a multiple for the acquisition that would reduce the acquisition return-on-capital to the identical level of the organic growth return-on-capital. This step establishes the absolute ceiling price/multiple that can be attributed to the target’s loan portfolio.
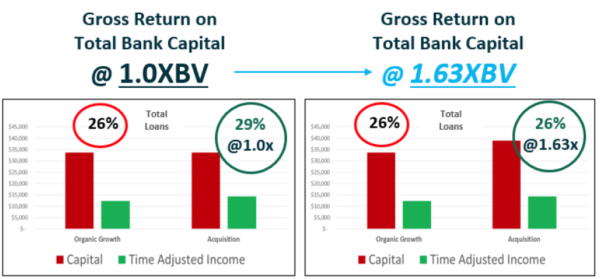
Remember, transactions will more often than not require a premium to book value. Rather than using comparative deal analysis to derive the premium paid, the acquirer should calculate the precise value of the seller’s loans to itself and then determine an offering price. The analysis allows the acquirer to quantify its return on capital from both organic growth and the acquisition (at book value). The return from organic growth is the acquirer’s baseline, or hurdle rate, above which the acquisition is attractive. The acquirer calculates its price ceiling (or its “break even” price) by adjusting the multiple until the return on acquisition equals exactly the return on organic growth. If the going market price for the seller is reasonably below the price ceiling, the acquirer knows that the acquired loan portfolio would contribute positively towards the final multiple over book value.
Conclusion
The results of these analytics should be a warning sign to all bankers. Interest rates will soon increase. Banks cannot grow their way to better profitability. Acquisitions could provide an attractive solution, but only if the analysis shows the hidden vintage-derived value in the acquired loans.